Finding Leaks with Colour and Bars
In preparation for a set of new “Leak Detector” screens in Poker Copilot, I’m reading Stephen Few‘s “Now You See It: Simple Visualization Techniques for Quantitative Analysis“. The subtitle is tedious, better would be “Make Awesome Charts.”
I’m getting a lot of value from Few’s book on using colour and simple charting techniques to make analysis easier. Here’s what I started with:
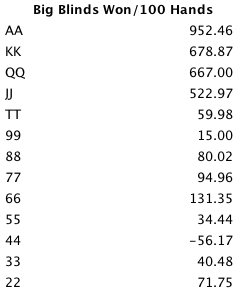
The info is there, but you have to read and compare all numbers carefully to spot the patterns.
Step 2: I added colour to show positive and negative numbers:
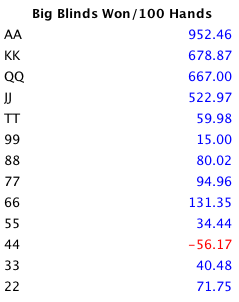
Now we can immediately see that I’ve been losing money with 44, and winning with all other pocket pairs. But some info is still hiding, requiring careful manual analysis.
Step 3: Show the magnitude with a coloured bar:
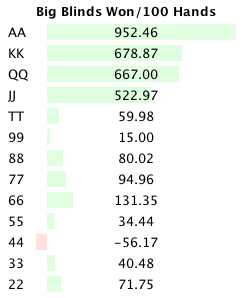
Ho ho! Now the patterns are clear. I’m doing something wrong with TT and 99, which should be good earners: my winnings are positive but only just. Aces, Kings, Queens, Jacks are all paying out well, so I’m happy with the way I play them.