Day 6: Creating the Charts
Charts are important for my poker app. I’m using a nice open source Java charting library called JFreeChart. Well, sort of nice. It’s powerful and flexible but comes with no documentation. If you actually want to know how to use it, you have to pay 30 euros for the documentation and demos. However I found it was well worth paying the money. With the help of the docs, sample code, and forums, you can make JFreeChart do just about anything.
I use JFreeChart not only to create my poker app’s main charts, but also the sparklines. The sparklines were tricky, but with the helpful JFreeChart forums I soon had it sorted.
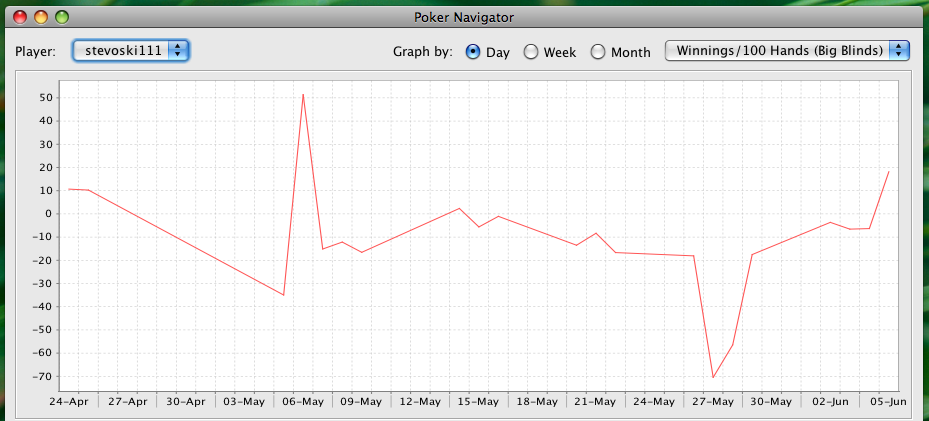
A great benefit of using JFreeChart is the ability to customise just about every aspect of a chart. Here’s what my line charts looked like before I customised the line renderer:
With a bit of inspiration from Google Analytics, here’s what my line charts look like now:
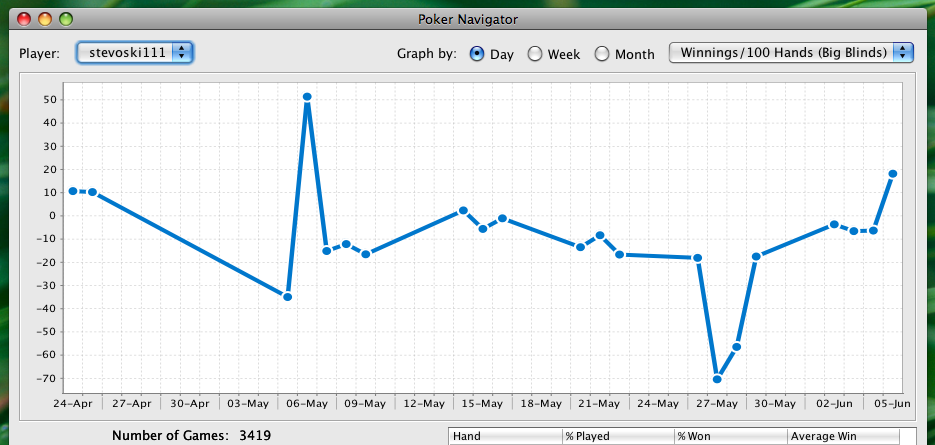
The customisation took about 10 lines of code. As ever, the difficulty lies in knowing what 10 lines of code to write.